Flex Builder debugger tip: Highlight the breakpoint that was just hit
A minor tip: I suggest turning on Eclipse’s “Link with Debug View” command in the Breakpoints view, and leaving it on:
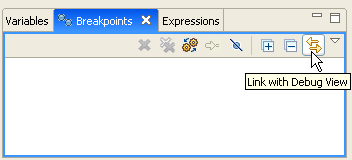
This confusingly named command is actually kind of useful. The effect of this command is that every time you hit a breakpoint, the Breakpoints view will highlight the breakpoint that just got hit. This is useful after you’ve been debugging for a while, and your Breakpoints view has gotten cluttered with a bunch of old breakpoints that you haven’t gotten around to deleting.
Of course, in a way it’s pretty obvious which one you just hit – after all, you can see which line you’re on – but still, finding it in the Breakpoints view can be tedious if there are a lot of breakpoints.
So why is it called “Link with Debug View” instead of something like “Highlight current breakpoint”? Because Eclipse allows multiple simultaneous debugging sessions, several of which could be stopped at separate breakpoints. The problem is compounded for languages like Java that support multiple threads – several threads could be stopped at separate breakpoints. So, what the “Link with Debug View” command actually does is, each time you change the selection in the Debug view (the view with the callstack), if your new selection corresponds to a stack frame that is currently at a breakpoint, then the Breakpoints view will highlight the corresponding line.
